Bluewater Methodology
Developed by traders to give you a simple and time tested methodology to trade the markets. This methodology
is based on market behaviors that do not change over time hence the charts we provide remain the same
over time without the need to continously adjust and tweak.
Once learned and internalized you can adjust time frames to better fit your individual needs as you make the charts your own.
Through this site and our services you are going to get an understanding of
markets previously reserved for Exchange members only. Our site, hand feeds you specific,
timely research, market information and proprietary software that exploits the
Market Profile information on every page and screen.
Why the Market Profile? It is a technical analysis tool developed for Exchange members.
It is the only technical analysis tool that has an Exchange’s name on it. It is the primary
tool used by traders that can control large amounts of the money in a market at any given moment.
If you don’t understand the market profile, you could be short changing yourself, so do yourself a
favor and get plugged into the world of the Market Profile, the only tool that combines time and price
in one display. The only tool developed by an exchange for its members, the most savvy and well capitalized
segment of the market.
The Bluewater platform has the BEST implementation of the market profile and
also adds the unique and proprietary feature enhancement of overlaid volume to give you the edge you need
and to visualize volume skewing in the market.
Every day you will get published research that makes specific trade recommendations, before the fact.
A trading chat room that is open from 0800 till 1600 ET. Hourly market commentary, updated trade
recommendations as needed, live and post trade commentary, and an end of the day wrap up and specific
trade recommendations for the overnight and next day’s markets.
Click here to check out our Daily Market Analysis »
3-2-1 Trading Methodology
Our trading methodology is simplicity itself: 3 Rules, 2 Patterns and one indicator. Our fully disclosed
trading setup is based on the Market Profile© and the market’s structure as defined by our longer term
distributions. It is tested daily in our trading room by our members.
The trading methodologies are based on transparent specific setups, a trigger, entry rules and an
exit rule based on defined trading targets that suit a client’s particular needs.
Click here for The 3-2-1 Trading Methodology Whitepaper »
Market Center Room
Our trading room offers analysis 4 times a day. At the end of the trading day the market analysis / home work
for the next trading day is done. We walk through the specific trade setups and discuss how to properly
manage the trade once it is taken.
Charting Platform Videos
Here are some videos for guests so you can understand what's on the charts. They aren't meant to teach
you how to use the charts, only to give you a basic understanding so you will be able to follow more of
what's going on it the rooms.
Click here to check out our Platform Videos »
Default Methodology Charts
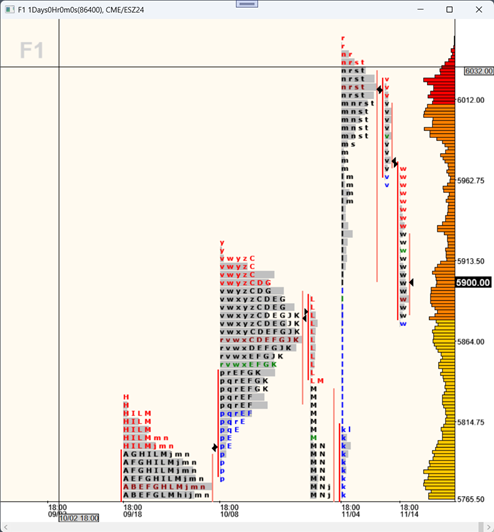
The F1 Chart
The F1 chart shows you the
Capital Flow in the market and gives you the big picture of the markets action
and is the best time frame for evaluating what the market has done, what it is doing and where it is likely to go.
You want to trade with the capital flow, not against it.
Each TPO (character) on the profile represents one full trading day and the histogram to the right
shows you the volume traded at the respective price levels and is essential to understanding where support and resistance lies.
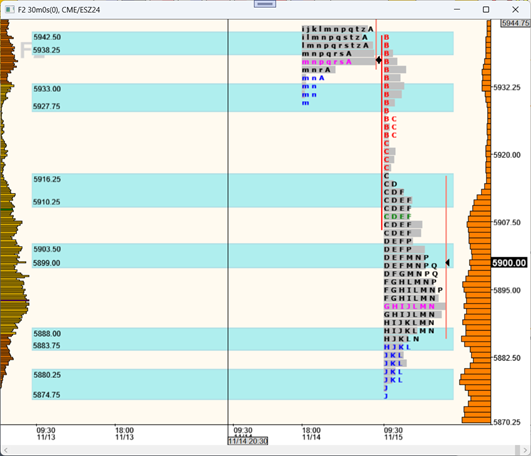
The F2 Chart
The F2 Chart is where the daily analysis and home work is done, where trades are refined and levels are set for entry and exit.
Each TPO (character) on the profile represents a half hour. The histogram to the right shows you long term volume traded
at the respective price levels and is essential to understanding where support and resistance lies. The histogram to the left
shows you the volume profile of the current trading session.
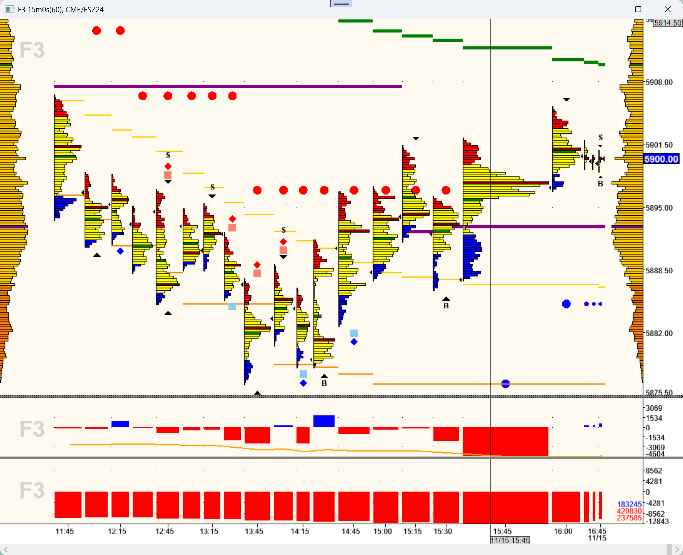
The F3 Chart
The F3 Chart displays 15 or 30 minute time periods and provides a volume profile in every time segment.
The top pane displays intraday volume information to better find trade location once you are in an area of interest.
The middle pane displays volume delta per bar and also a green/orange line representing unfiltered cumulative delta volume.
The lower pane displays filtered cumulative delta volume. Default trades that are included are 20 lot and above which can be adjusted as necessary.
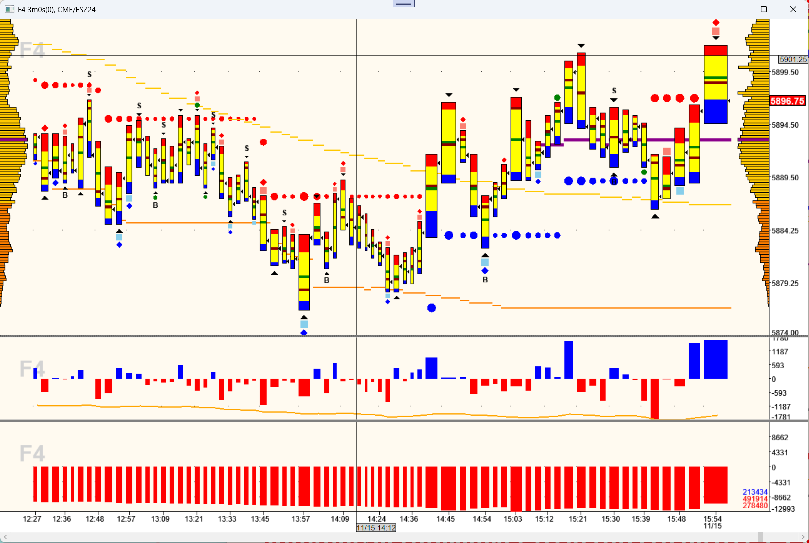
The F4 Chart
The F4 is the execution and trade management chart and is usually set to 3 or 5 minute bars, it is key in identifying prescribed trade setups
with the best possible trade location.
The top pane displays intraday volume information to better find trade location once you are in an area of interest.
The middle pane displays volume delta per bar and also a green/orange line representing unfiltered cumulative delta volume.
The lower pane displays filtered cumulative delta volume. Default trades that are included are 20 lot and above which can be adjusted as necessary.
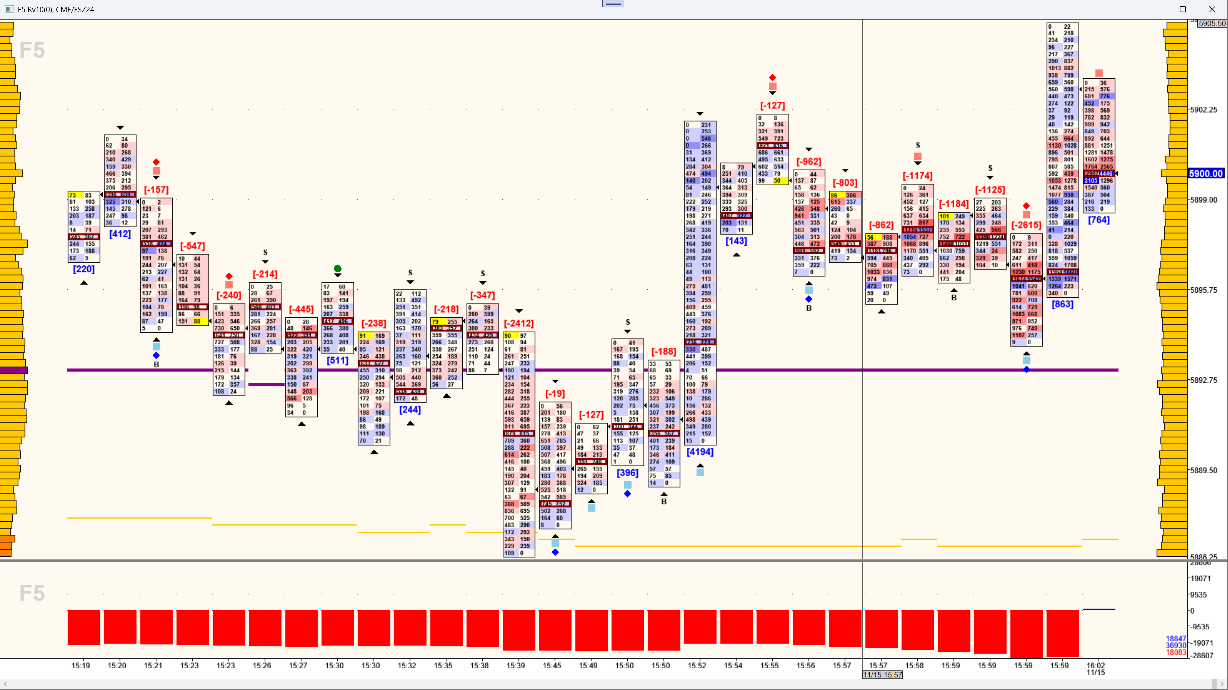
The F5 Chart
The F5 Chart is the electronic version of 'Reading the Tape'. It displays every trade with volume delta coloration to help identify short term
congestion areas. This chart is primarily used to manage trades.
The top pane displays intraday bid/ask volume information in real time.
The lower pane displays unfiltered cumulative delta volume that shows you the current net volume bias of the market.
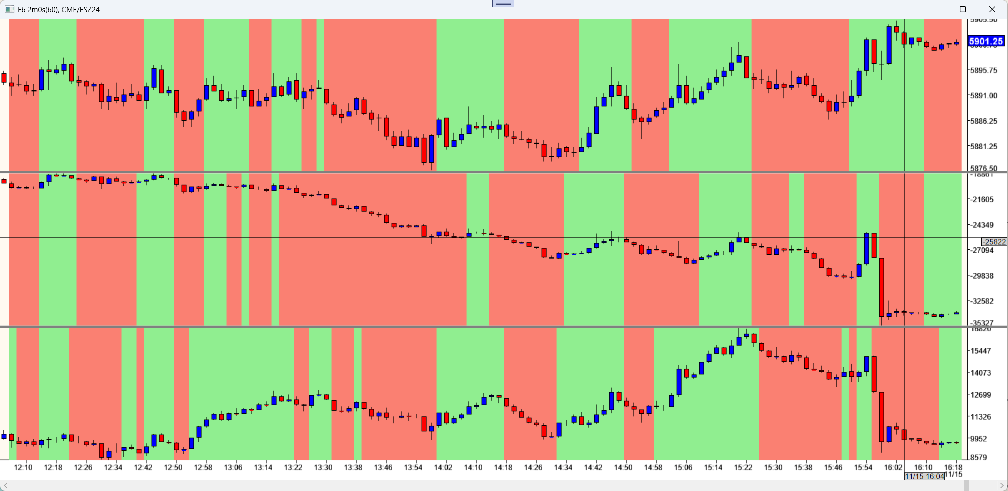
The F6 Chart
The F6 chart helps you to identify when institutions are trading in the market and confirms the direction of the trade.
The top pane displays price bars with background colored by a Tillson moving average of price.
The middle pane displays cumulative delta volume displayed as bars with the background colored using a Tillson moving average of the cumulative volume delta.
The lower pane displays cumulative delta ticks displayed as bars with the background colored using a Tillson moving average of the cumulative volume ticks.
Resources
Market Profile Overview by Charles Cochran
The 3-2-1 Trading Methodology
Market Profile Handbook
TPO Assignments