
Methodology
A simple, time‑tested way to trade the markets
Developed by traders, the Bluewater Methodology is built on market behaviors that do not change over time. Once you internalize the concepts, you can adapt time frames and make the charts your own—without constantly tweaking indicators or chasing the latest “system.”
The only technical tool with an exchange’s name on it!
Market Profile was developed for exchange members and is the primary tool used by traders who can control large amounts of capital at any moment. It is the only tool that combines time and price in a single display.
If you don’t understand Market Profile, you may be short‑changing yourself. The Bluewater platform delivers one of the best implementations of Market Profile and adds overlaid volume to help you see volume skewing and key support and resistance levels.
You’re not trading alone—you’ve got a methodology.
DEFAULT METHODOLOGY CHARTS
A structured chart set for reading capital flow and trade location
F1 Chart – Capital Flow Overview
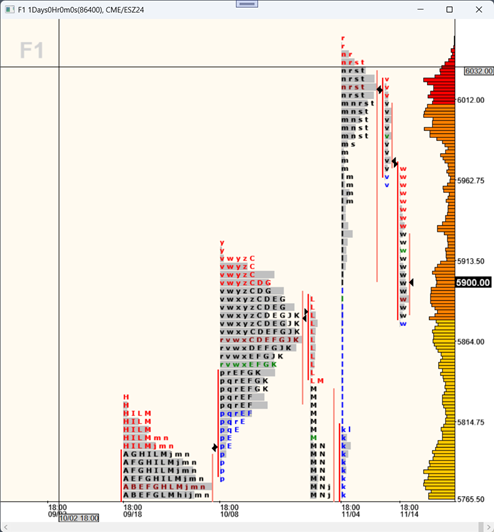
Shows the big picture of market action so you can trade with capital flow, not against it. Each TPO represents a full trading day, with a right‑side volume histogram to reveal key support and resistance.
F2 Chart – Daily Analysis & Levels
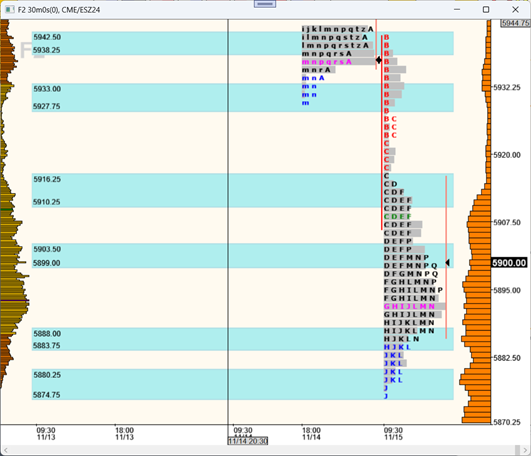
The homework chart. Each TPO is a 30‑minute period, with long‑term volume on the right and current‑session volume on the left to refine entries and exits.
F3 Chart – Intraday Volume Profile
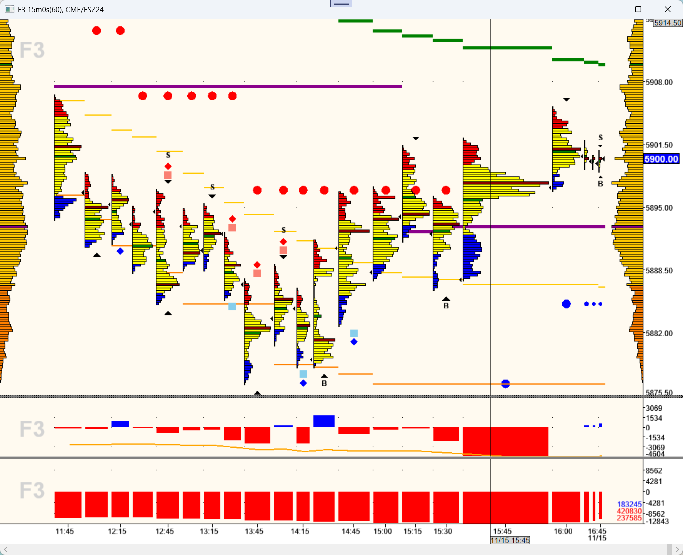
Displays 15 or 30‑minute periods with a volume profile in each segment. Includes intraday volume, bar‑by‑bar volume delta, and cumulative delta views to refine trade location.
F4 Chart – Execution & Trade Management
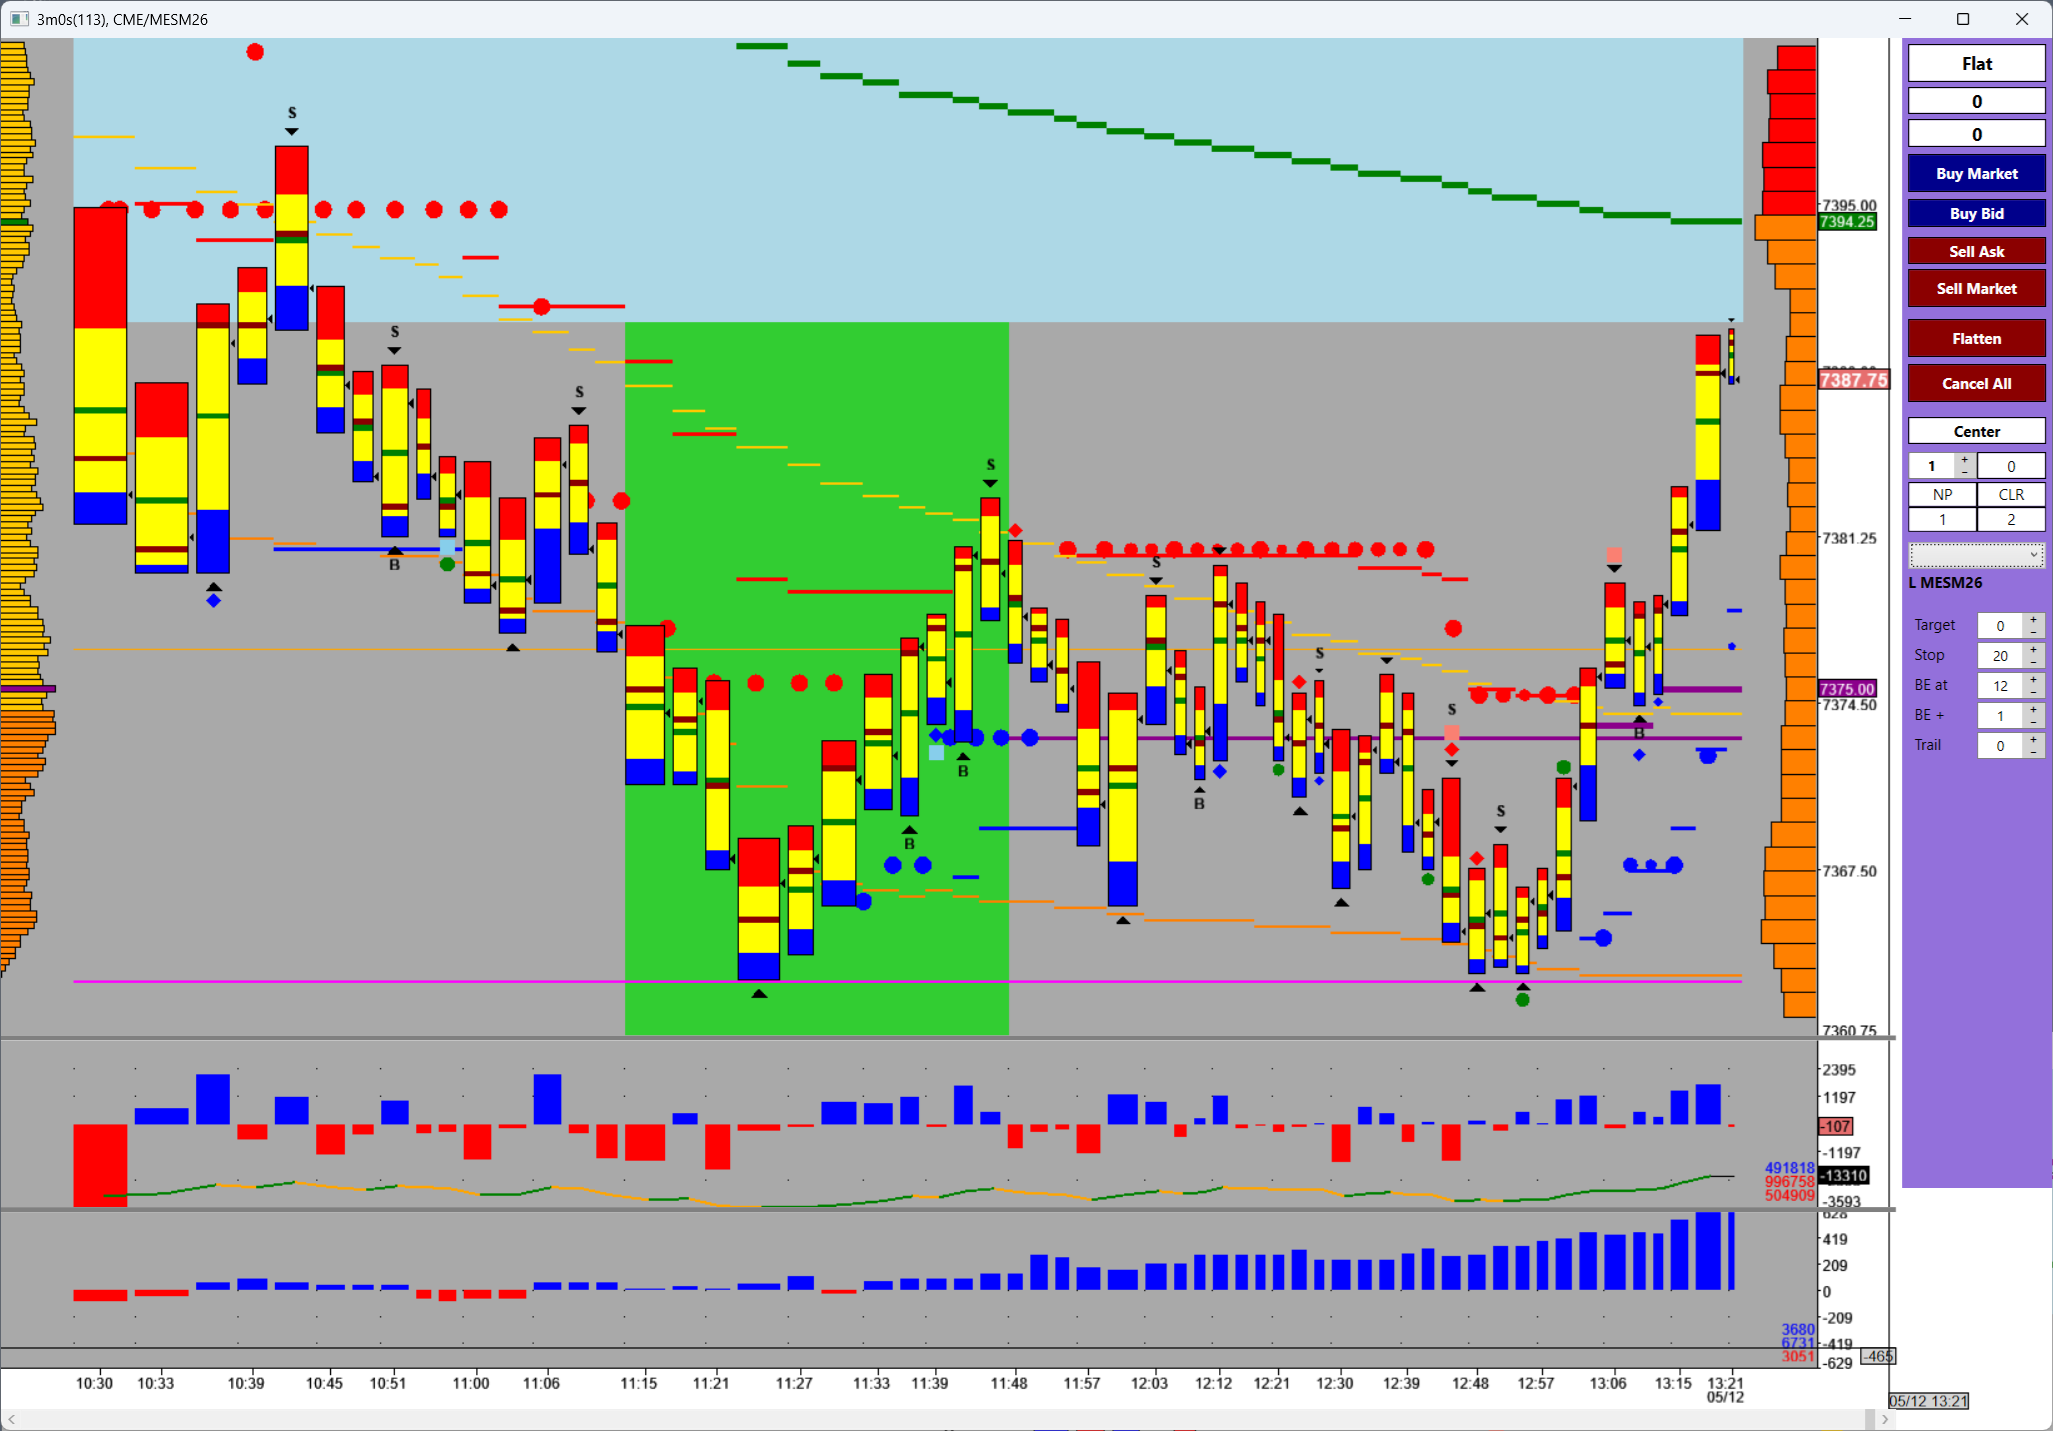
Typically set to 3–5 minute bars, this is the execution chart for prescribed setups and best possible trade location, with the same intraday and delta panes as F3.
F5 Chart – Reading the Tape
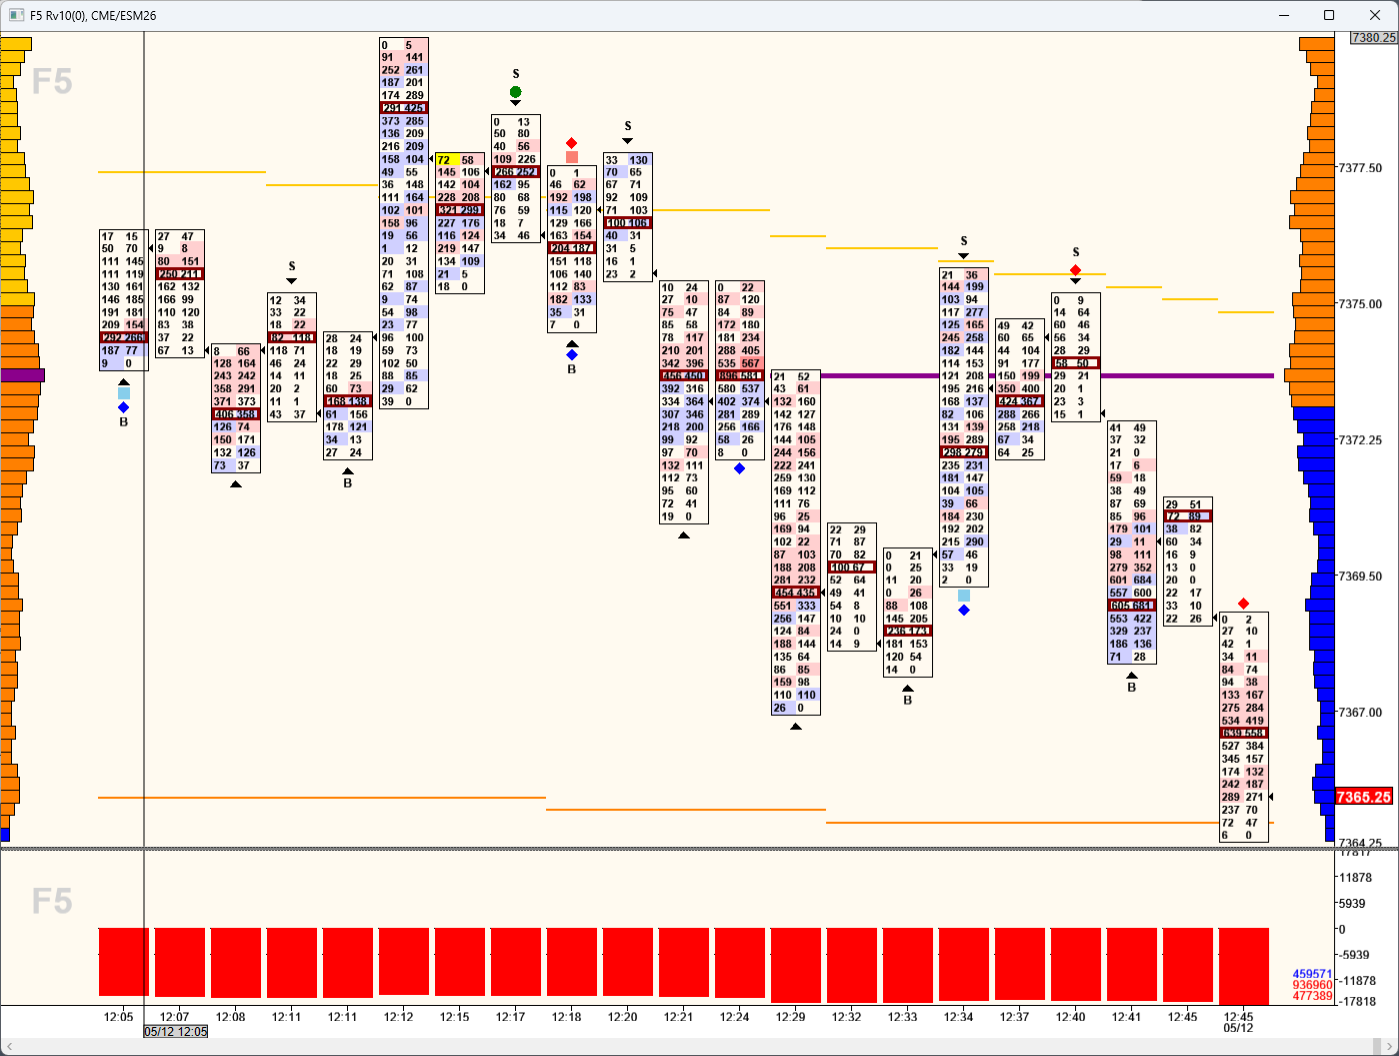
An electronic “tape reading” view that displays every trade with volume‑delta coloration to highlight short‑term congestion. Includes real‑time bid/ask volume and unfiltered cumulative delta.
F6 Chart – Institutional Activity
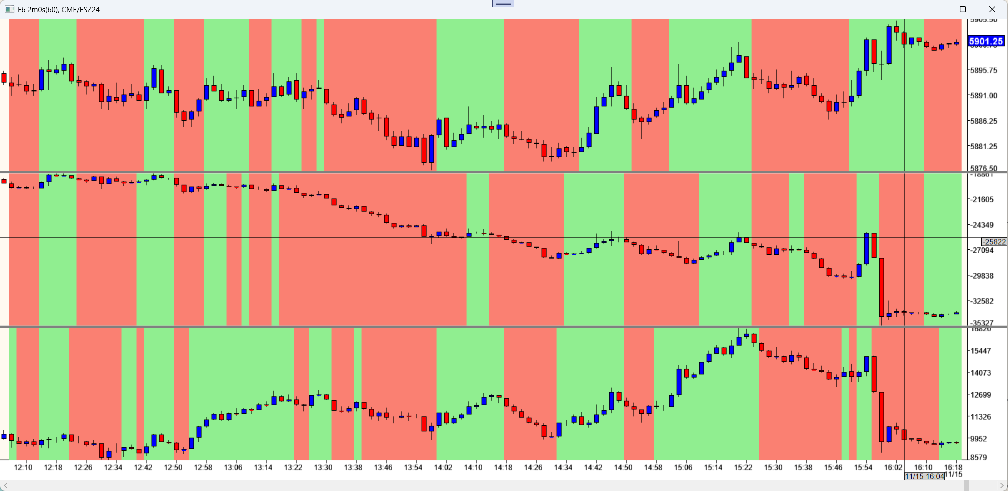
Helps identify when institutions are active and confirms trade direction using Tillson‑smoothed price, cumulative delta volume, and cumulative delta ticks.
REFERENCE MATERIALS