
Platform
Trading Platform
Developed by traders, the Bluewater Methodology is built on market behaviors that do not change over time. Once you internalize the concepts, you can adapt time frames and make the charts your own—without constantly tweaking indicators or chasing the latest “system.”
Key Platform Highlights
Simple and straight forward trading platform focused on the key features you need to trade.
Create your own Custom Charts using Time, Tick, Volume, Renko bars etc. with the most common studies available. Charts can be switched between simulation and live trading on the fly and gives you a simple and intuitive way to trade right off the chart.
The BEST Market Profile implementation on the market that gives you a superior tool for analyzing and trading the markets.
Basic Order Bracketing with breakeven and trail behaviors available without any need for fancy programming.
Advanced Order Strategies if you need to get fancy about building your Entry or Exit order strategies this feature allows you to create advanced multi layered strategies.
Advanced Order Flow analysis providing cumulative Delta studies, Time and Sales with advanced volume filtering and aggegration features.
Strategy Builder to build your own trading strategies using a simple user interface to create trading systems that can utilize advanced order strategies to manage your positions while you focus on the position entry criteria.
PLATFORM FEATURES
Key Platform Features
Basic Trade Chart with Order Bracketing
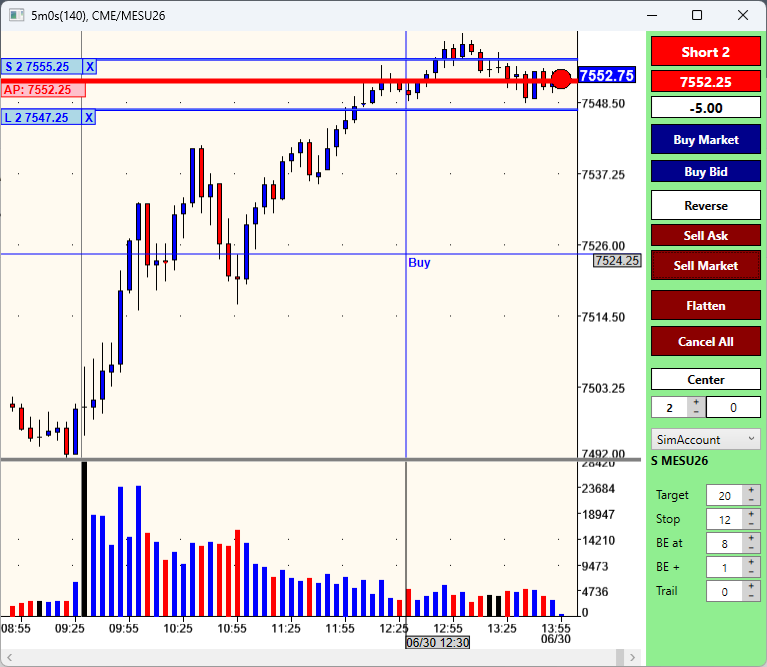
Basic Trade Chart with simple order bracketing. From here you can add views, studies, change to bar type and a lot more to fit your needs.
Market Profile
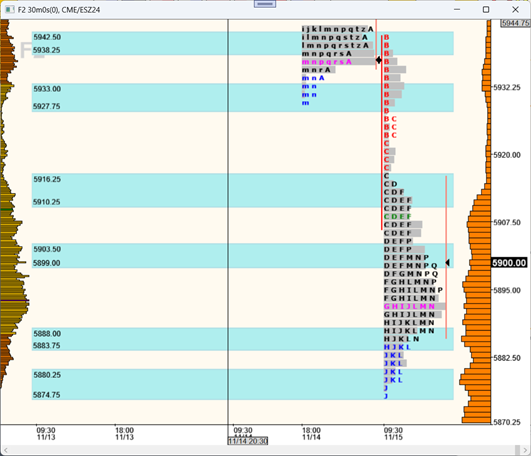
The homework chart. Each TPO is a 30‑minute period, with long‑term volume on the right and current‑session volume on the left to refine entries and exits.
Advanced Bars – Intraday Volume Profile
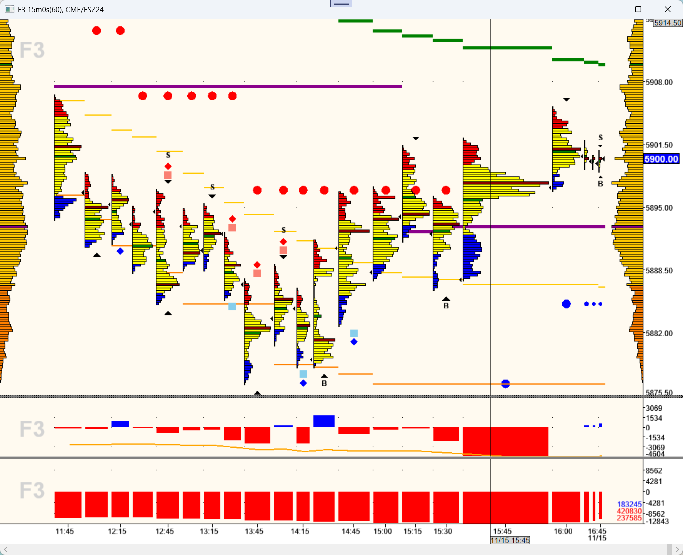
Displays bars as a volume profiles with cumulative delta views to refine trade location.
Build Strategies using a Simple Interface
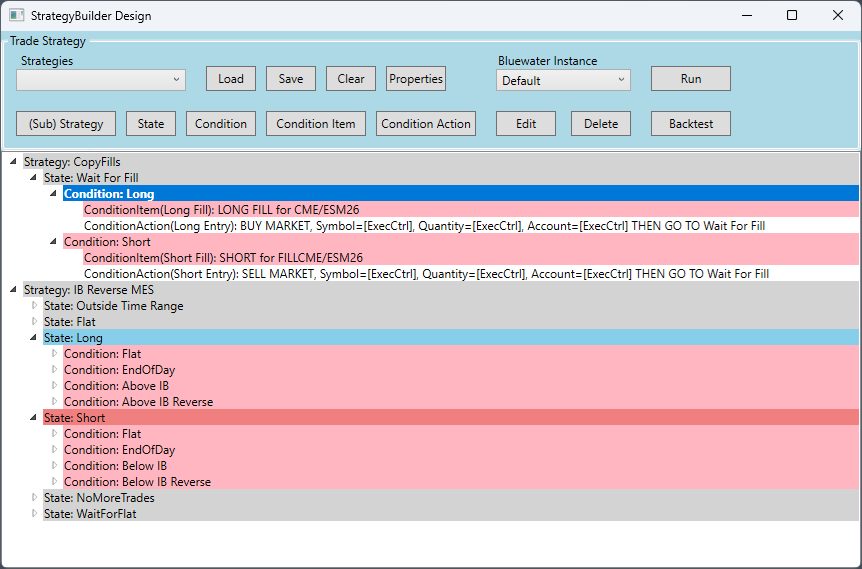
Using a simple user interface to create your own trading startegy using a simple state-event model. Setup you charts then pick the studies and conditions to create the login then add actions to fire off trades and move to different states.
Order Flow Analysis with volume delta highlights
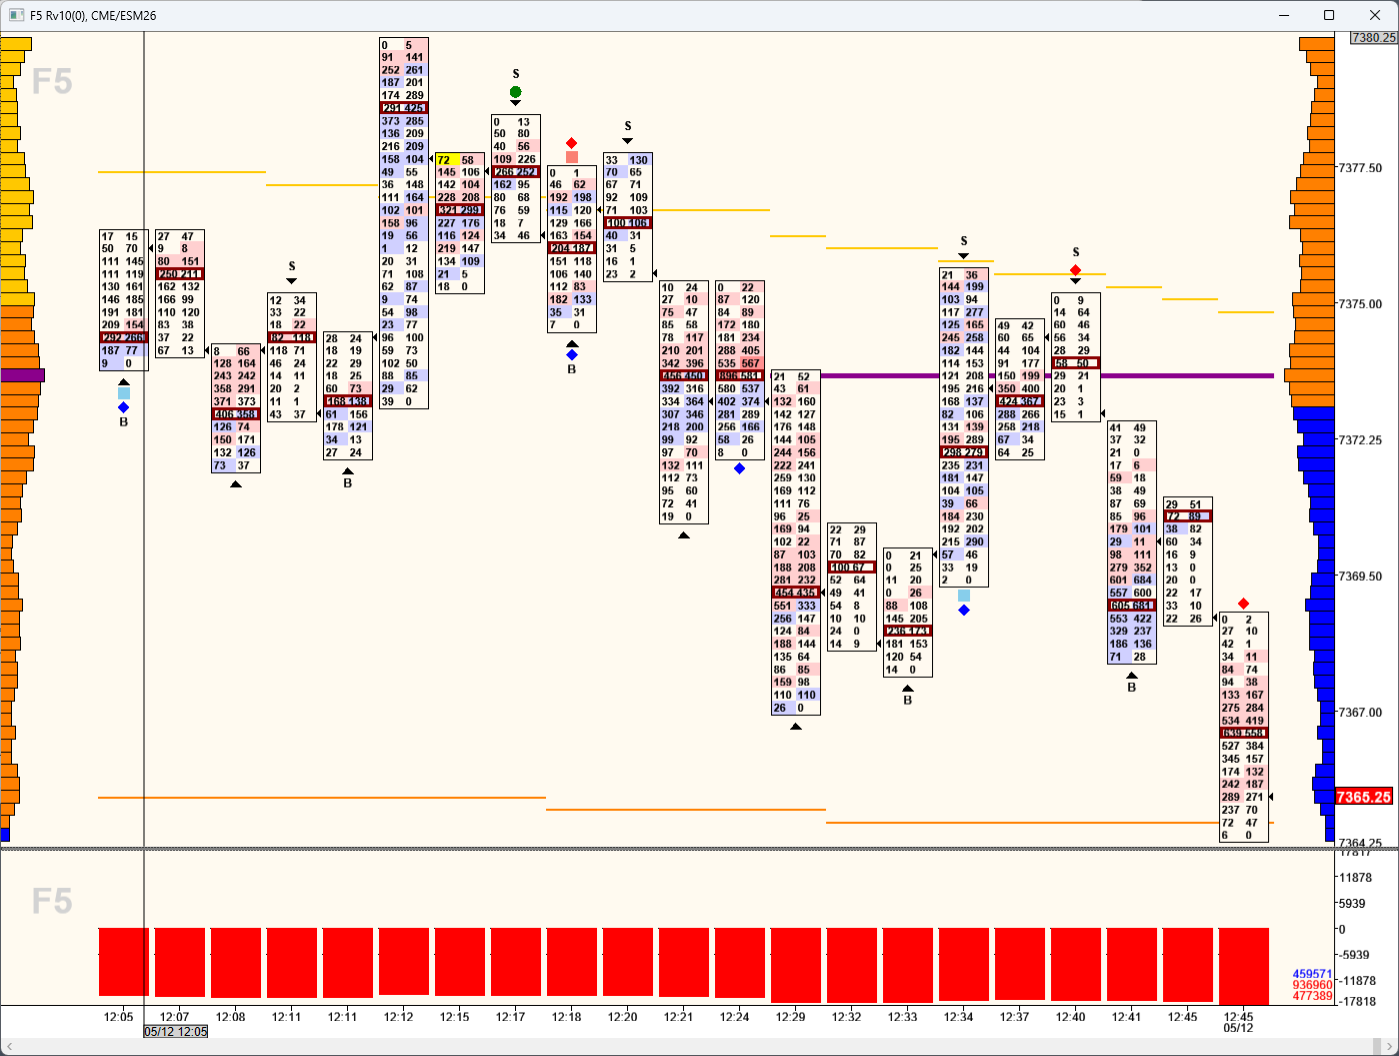
An electronic “tape reading” view that displays every trade with volume‑delta coloration to highlight short‑term congestion. Includes real‑time bid/ask volume and unfiltered cumulative delta.
Institutional Volume Filter
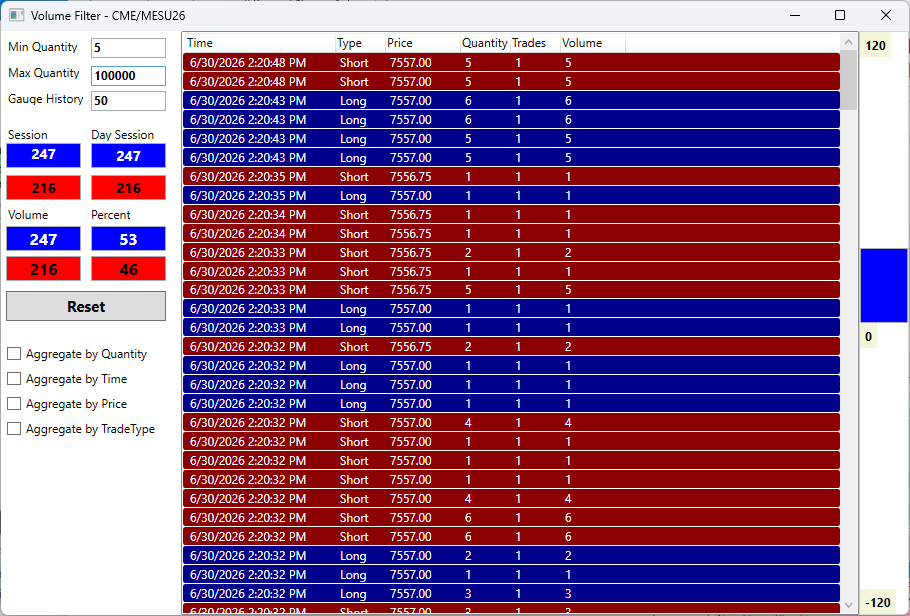
Shows time and sales activity with different filter options to match your needs. Shows a cumulative volume pressure indicator to the right including the last ticks as specified.
How-To Videos
Getting Started with Bluewater
Install, login, and place your first trade.
Trading on a Chart
Simplicity of chart trading.
Using the Symbol Manager
Your main screen to open charts and other tools.